Portfolio for Boston Dynamics, Full-Stack Engineer
(A more general robotics portfolio is available here)
There’s nothing more satisfying than sending robots out into the world after the design work is done. But after almost a decade of building and publicly deploying robots, I know that as soon as the design work ends, the diagnostics and monitoring work begins. Even the best deployments run into hiccups, and that gap between raw telemetry and actionable human insight is exactly where I work best.
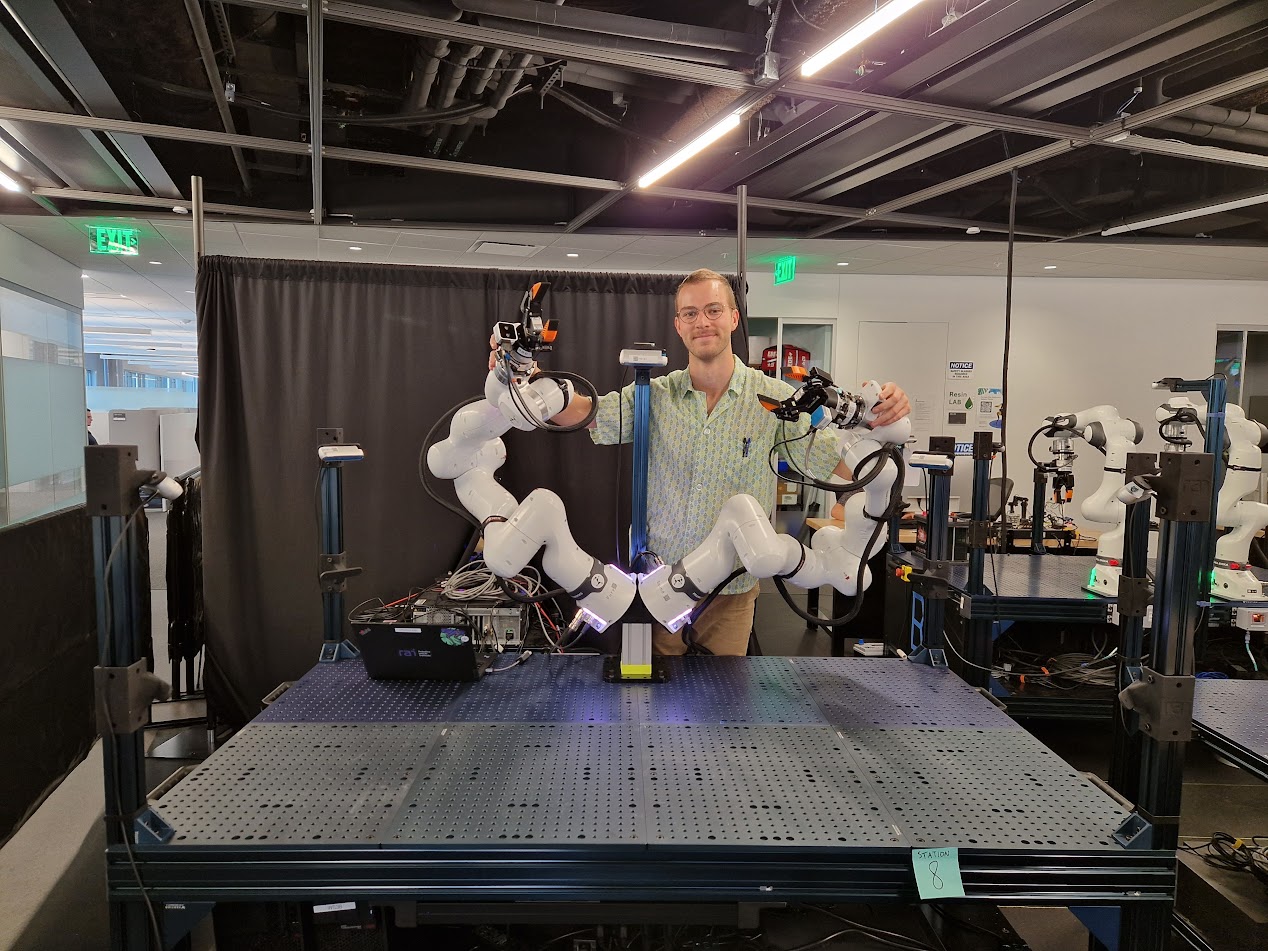
I currently serve as a Lab Operations Engineer at the RAI Institute, where I’m in charge of maintaining and streamlining operations in our “Arm Farm,” a lab with 24 robot arms used by five manipulation research groups. My task is straightforward: Make the arms work. I’ve identified key pain points in our manipulation hardware and software, spearheaded a major system standardization effort, developed novel force-aware teleoperation devices, and designed and maintained our central diagnostic software suite.
Diagnostics at RAI (2025 — Present)
While I won’t get into specifics, here’s the gist. Each arm research station is a complex cyberphysical network of cameras, arms, end effectors, and compute hardware, backed by a dense network of software threads and processes. The diagnostics system that I developed is a decentralized collection of agents, one per station, that periodically transmit logs to a server. Users can log into a full-stack web-based monitoring tool to view all arm stations. Through the dashboard, they can establish direct, live connections to individual stations to view diagnostic feeds. An interactive 3D model summarizes the complex diagnostic report into an intuitive, interpretable diagram. Time series data on key subsystems is graphed in a sidebar. The dashboard uses the exact design language of the organization.
In practice, this system is the kind of internal tool that keeps a fleet operational. When a researcher reports a problem, the dashboard lets us trace it from a vague symptom to a specific subsystem in minutes, not hours. That workflow— ingesting complex hardware data into a searchable, navigable interface that any troubleshooter can use— is exactly what I’d bring to the Knowledge Base and internal tools at Boston Dynamics.
I take pride in the system’s quality:
- Reliability: Even a minute of downtime can block an important experiment, so key components are covered by tests
- Performance: Data is securely cached in the browser’s localStorage and synched with the database seamlessly in the background. Sensor data is compressed where possible.
- Design: Every pixel is perfectly aligned. I add subtle details like drop shadows on hover. Colors and fonts are tuned to minimize distraction while maximizing clarity and consistency.
Technologies used: Svelte, MongoDB, FastAPI, three.js, Socket.io, Docker Compose, Playwright, pytest, vitetest.
Bloomcast (2025 — Present)
In my free time, I’m developing Bloomcast, a full-stack, AI-driven crop planning tool for sustainable farmers. At its core, Bloomcast is a data pipeline problem: I maintain a detailed crop parameter library and growth modeling system that ingests climate data, soil conditions, and farm-specific preferences, then transforms that complexity into a simple, actionable plan: a complete calendar, seed order sheet, and field map, generated automatically.
The UX challenge mirrors diagnostic tooling: farmers aren’t software engineers, and the underlying data is dense. The interface has to make hundreds of interconnected variables feel simple and even fun to navigate. That design instinct— making massive amounts of technical data approachable— is something I’d apply directly to the service and support workflows at BD.
While Bloomcast isn’t publicly released, I have active partnerships and early pilots with farmers in the Boston area.
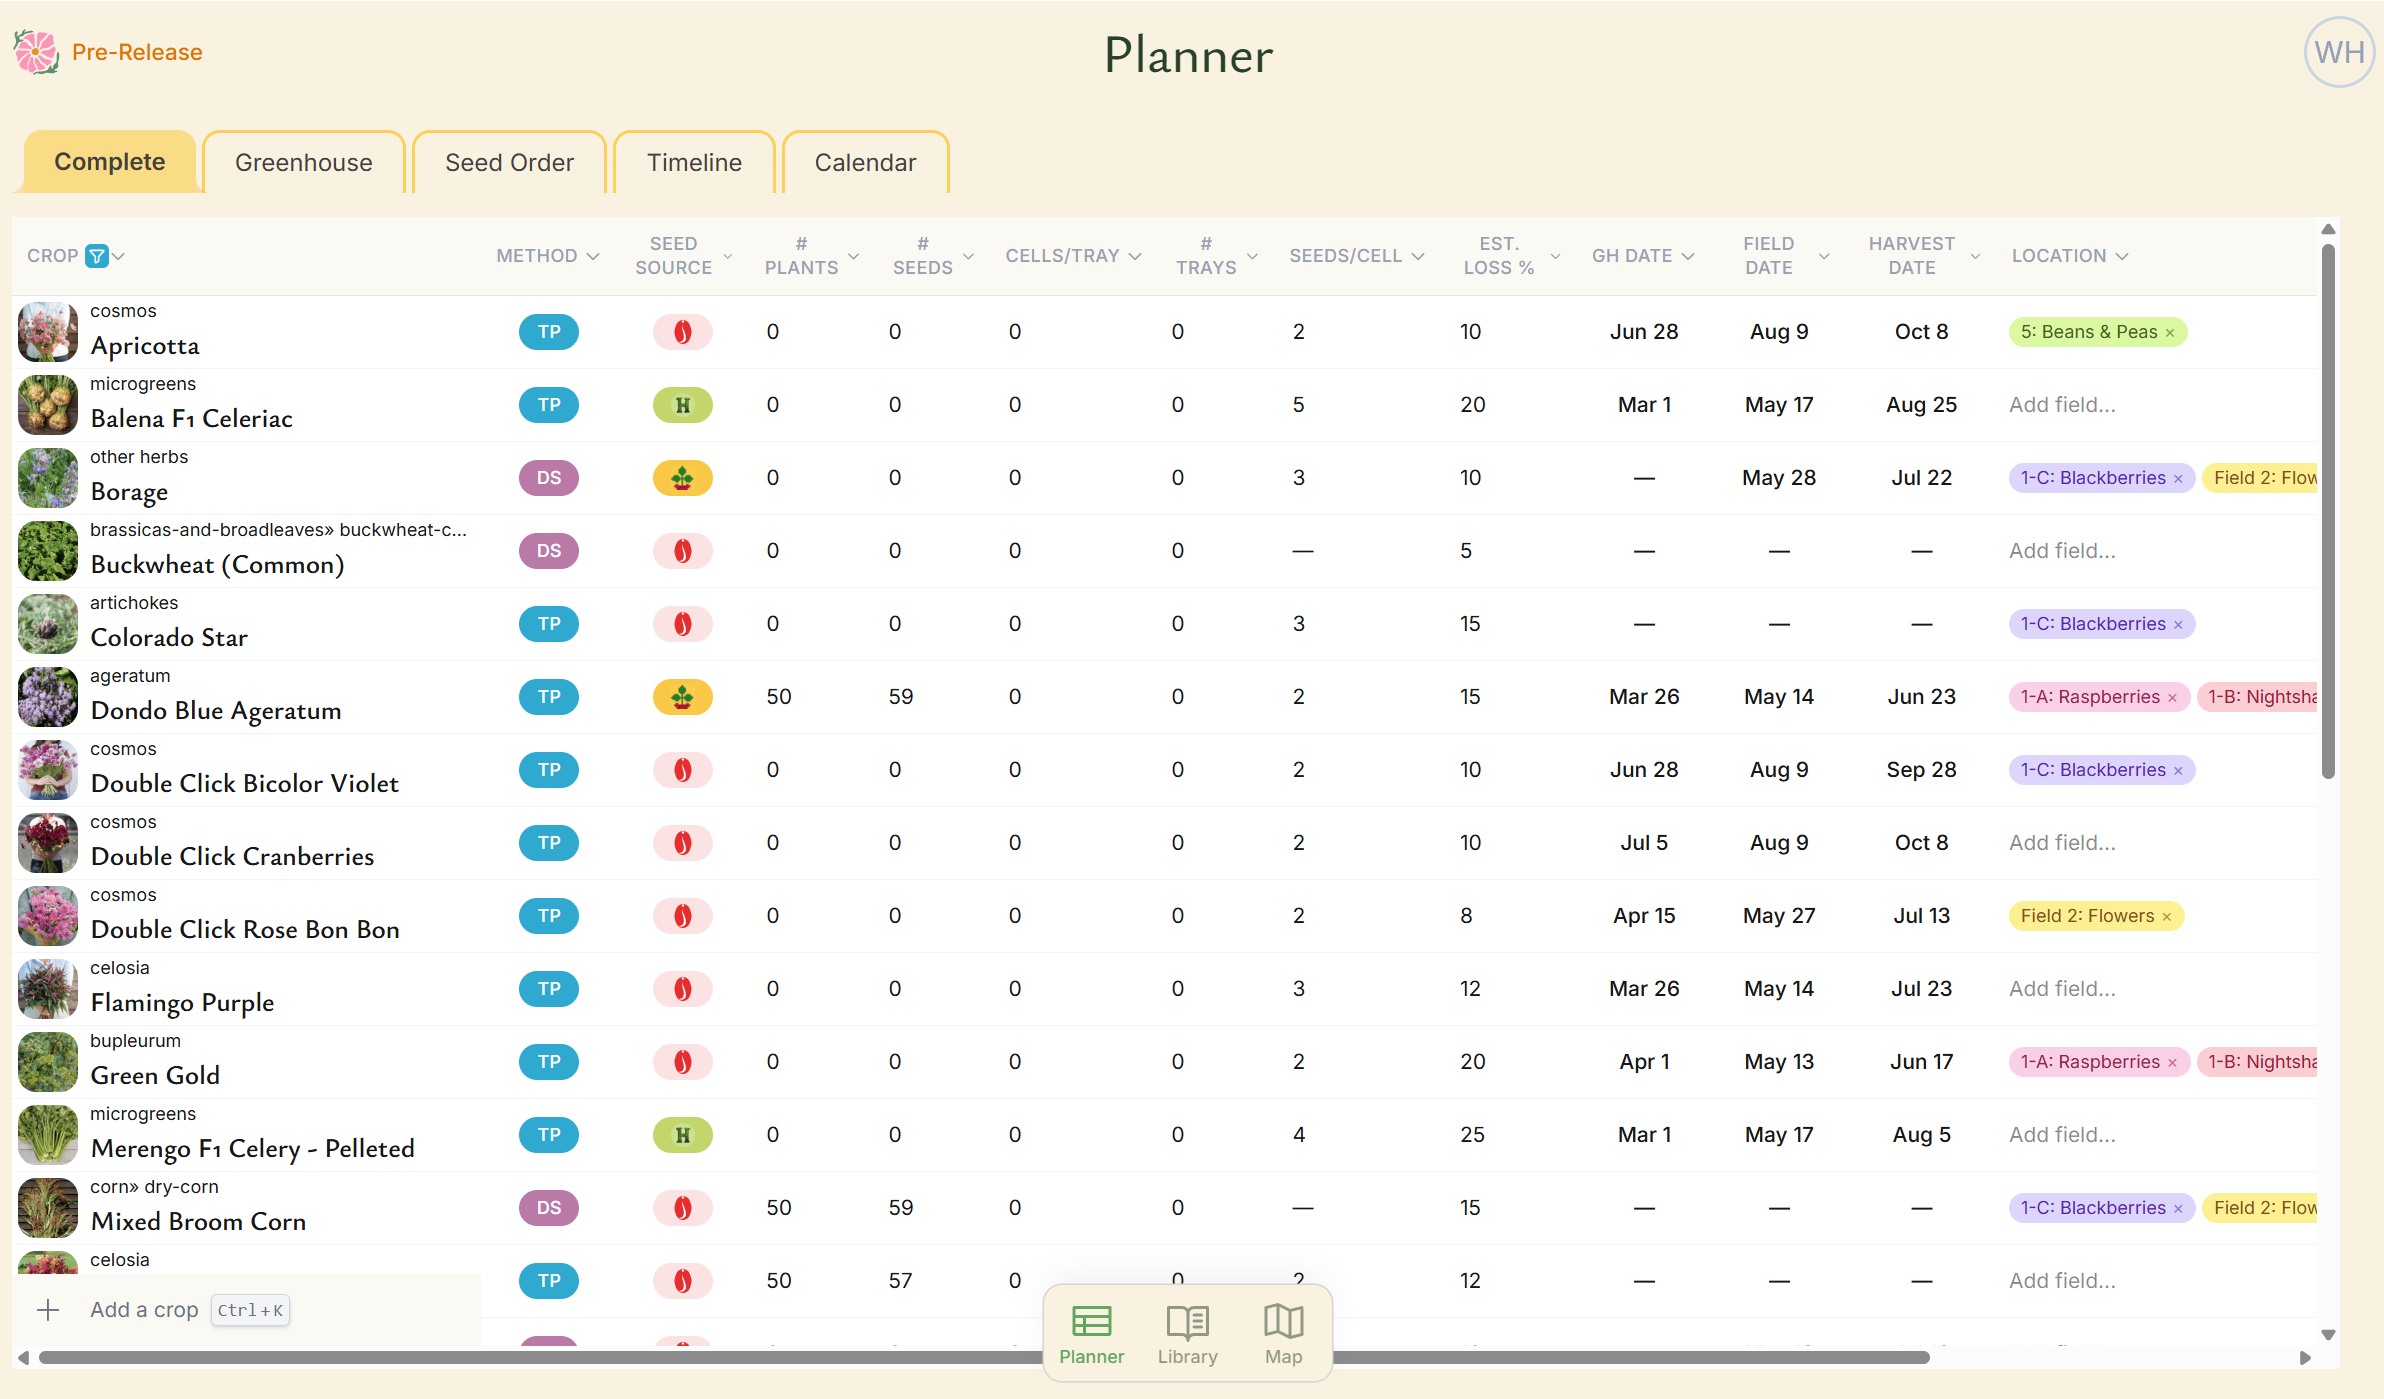
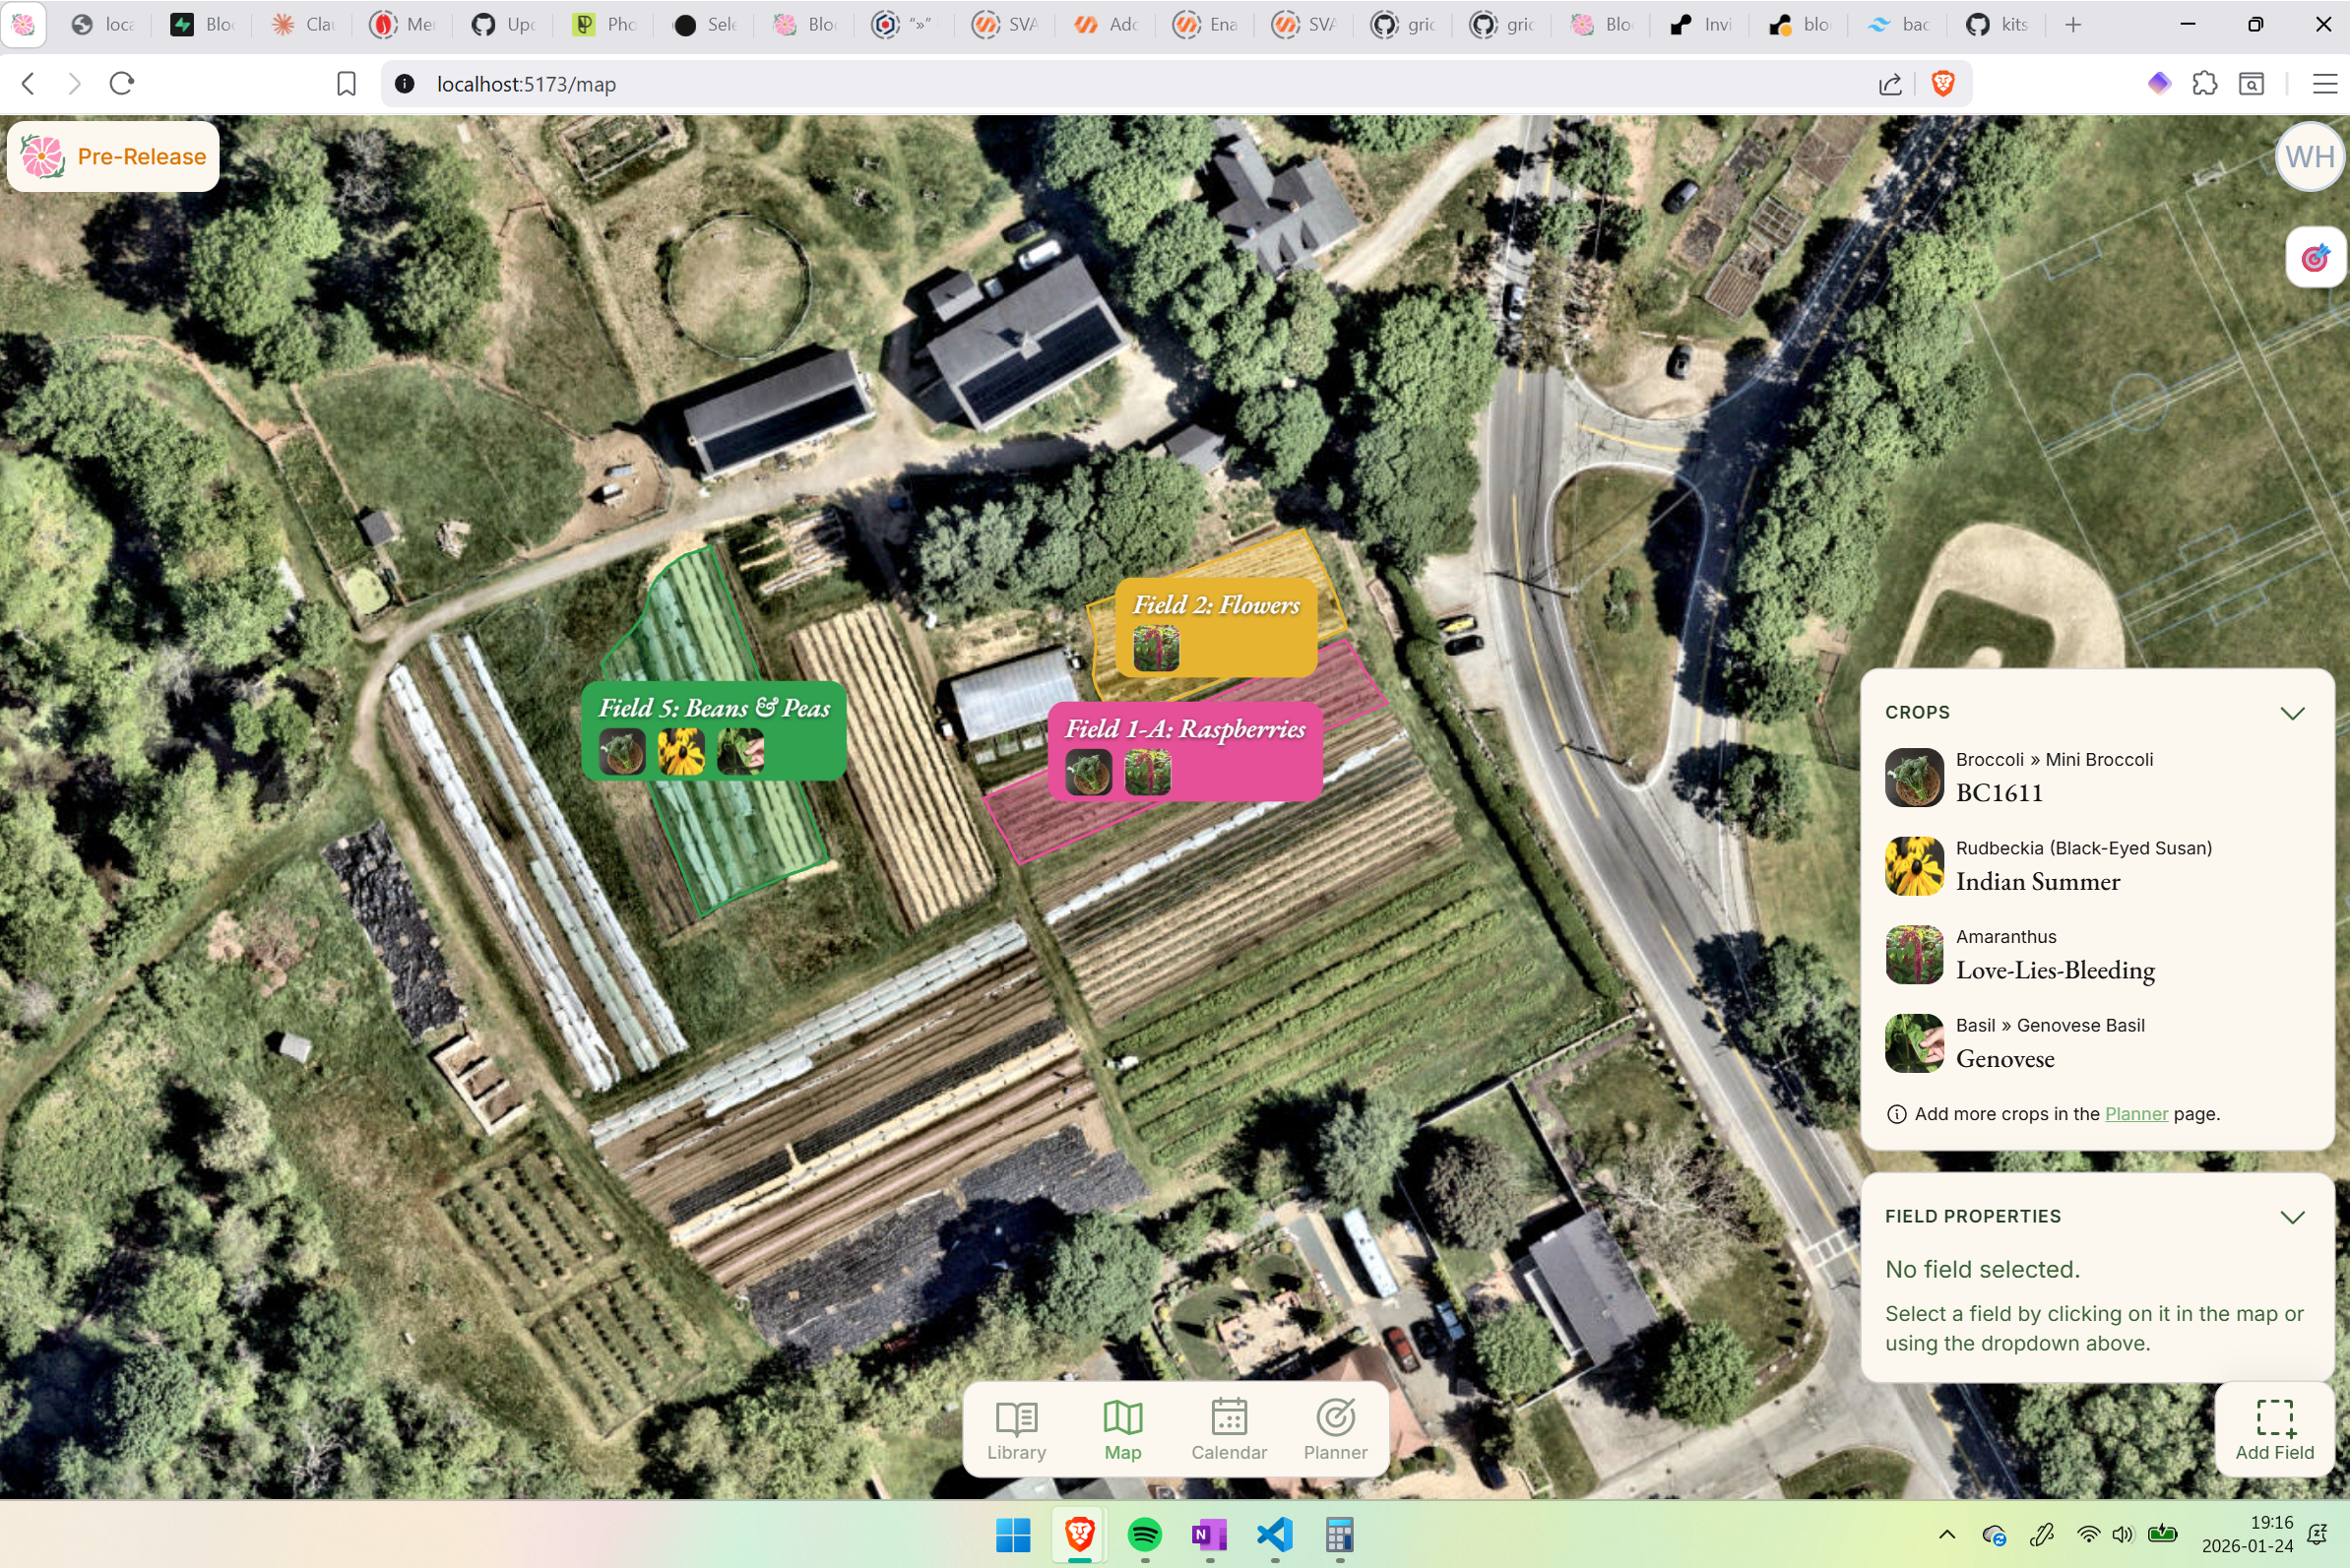
The Planner is a smarter alternative to spreadsheets. It features sortable, searchable columns, validation, pre-built formulas, and autofill backed by a powerful crop model. Most data, including ideal dates, is suggested automatically by the software.
Technologies used: Svelte, Supabase (database and auth), Resend (secure email API), Flask, Anthropic API, Posthog.
Reforestation robot and planning tool at CMU (2023 — 2025)
From 2023-2025, I served as project manager and software developer for a reforestation robotics project in the Kantor Lab within CMU’s Robotics Institute. I architected and implemented a complete robotics software stack, including perception, behavior planning, forest growth modeling, and a user interface.
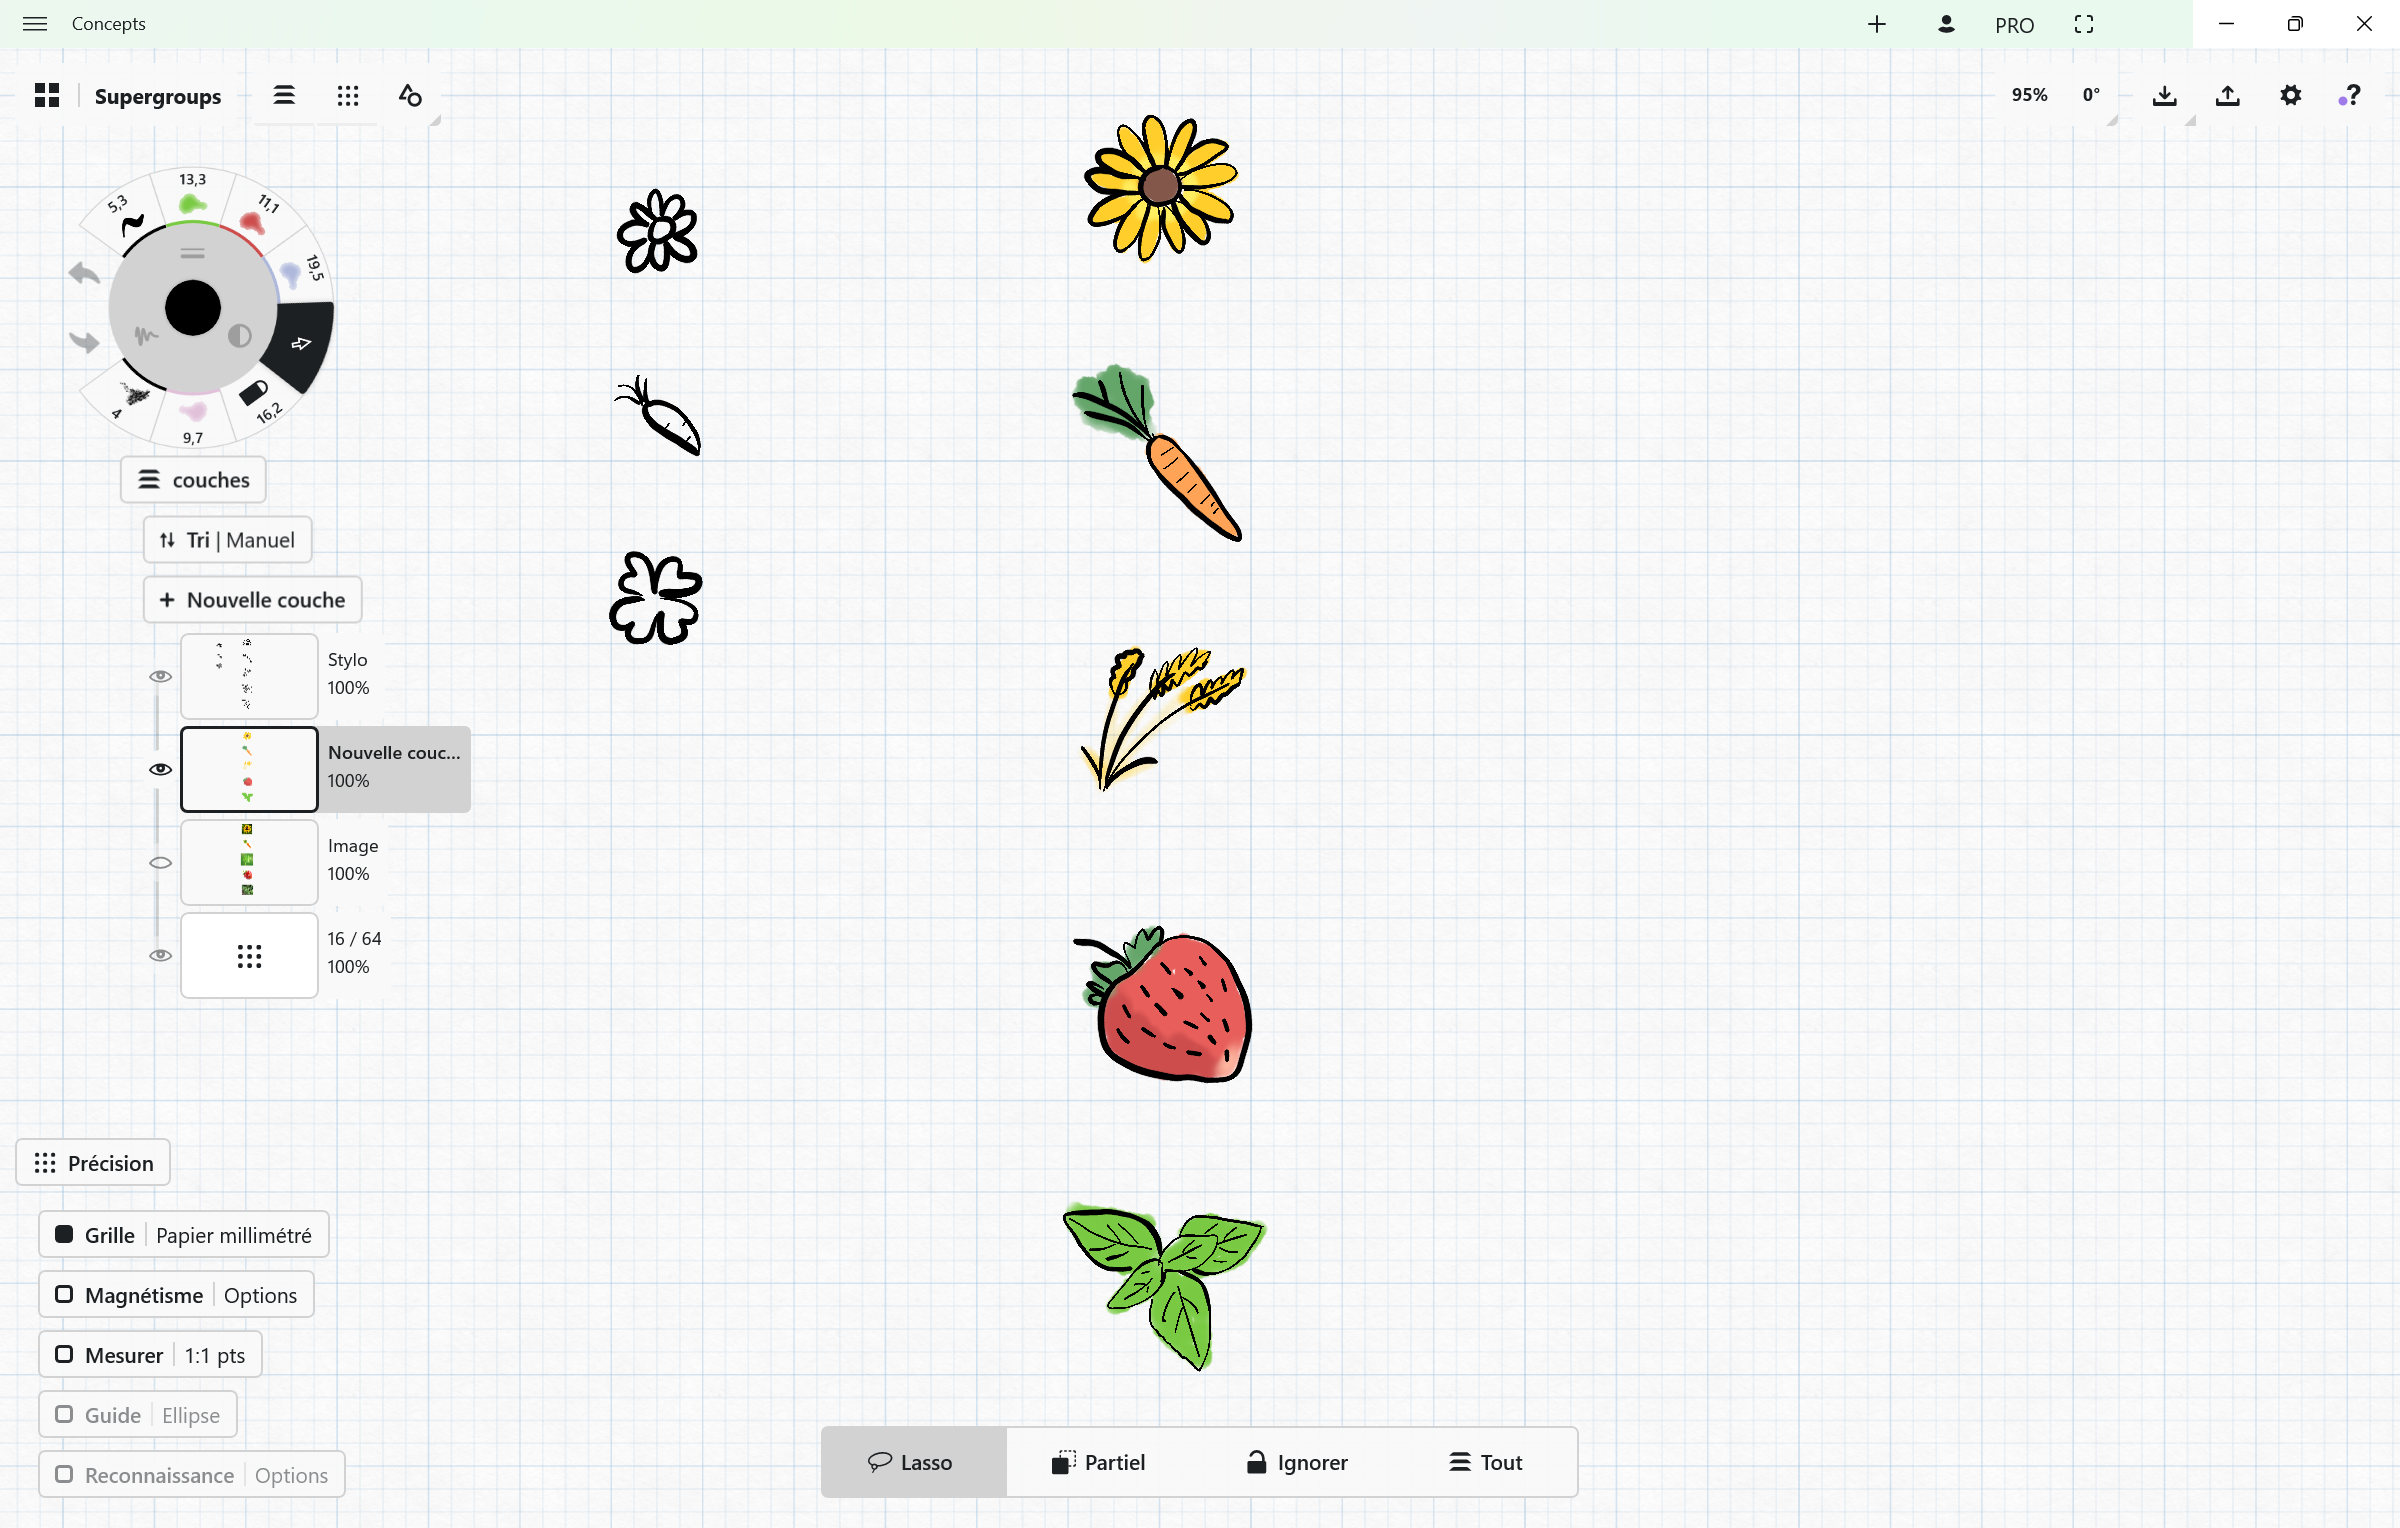
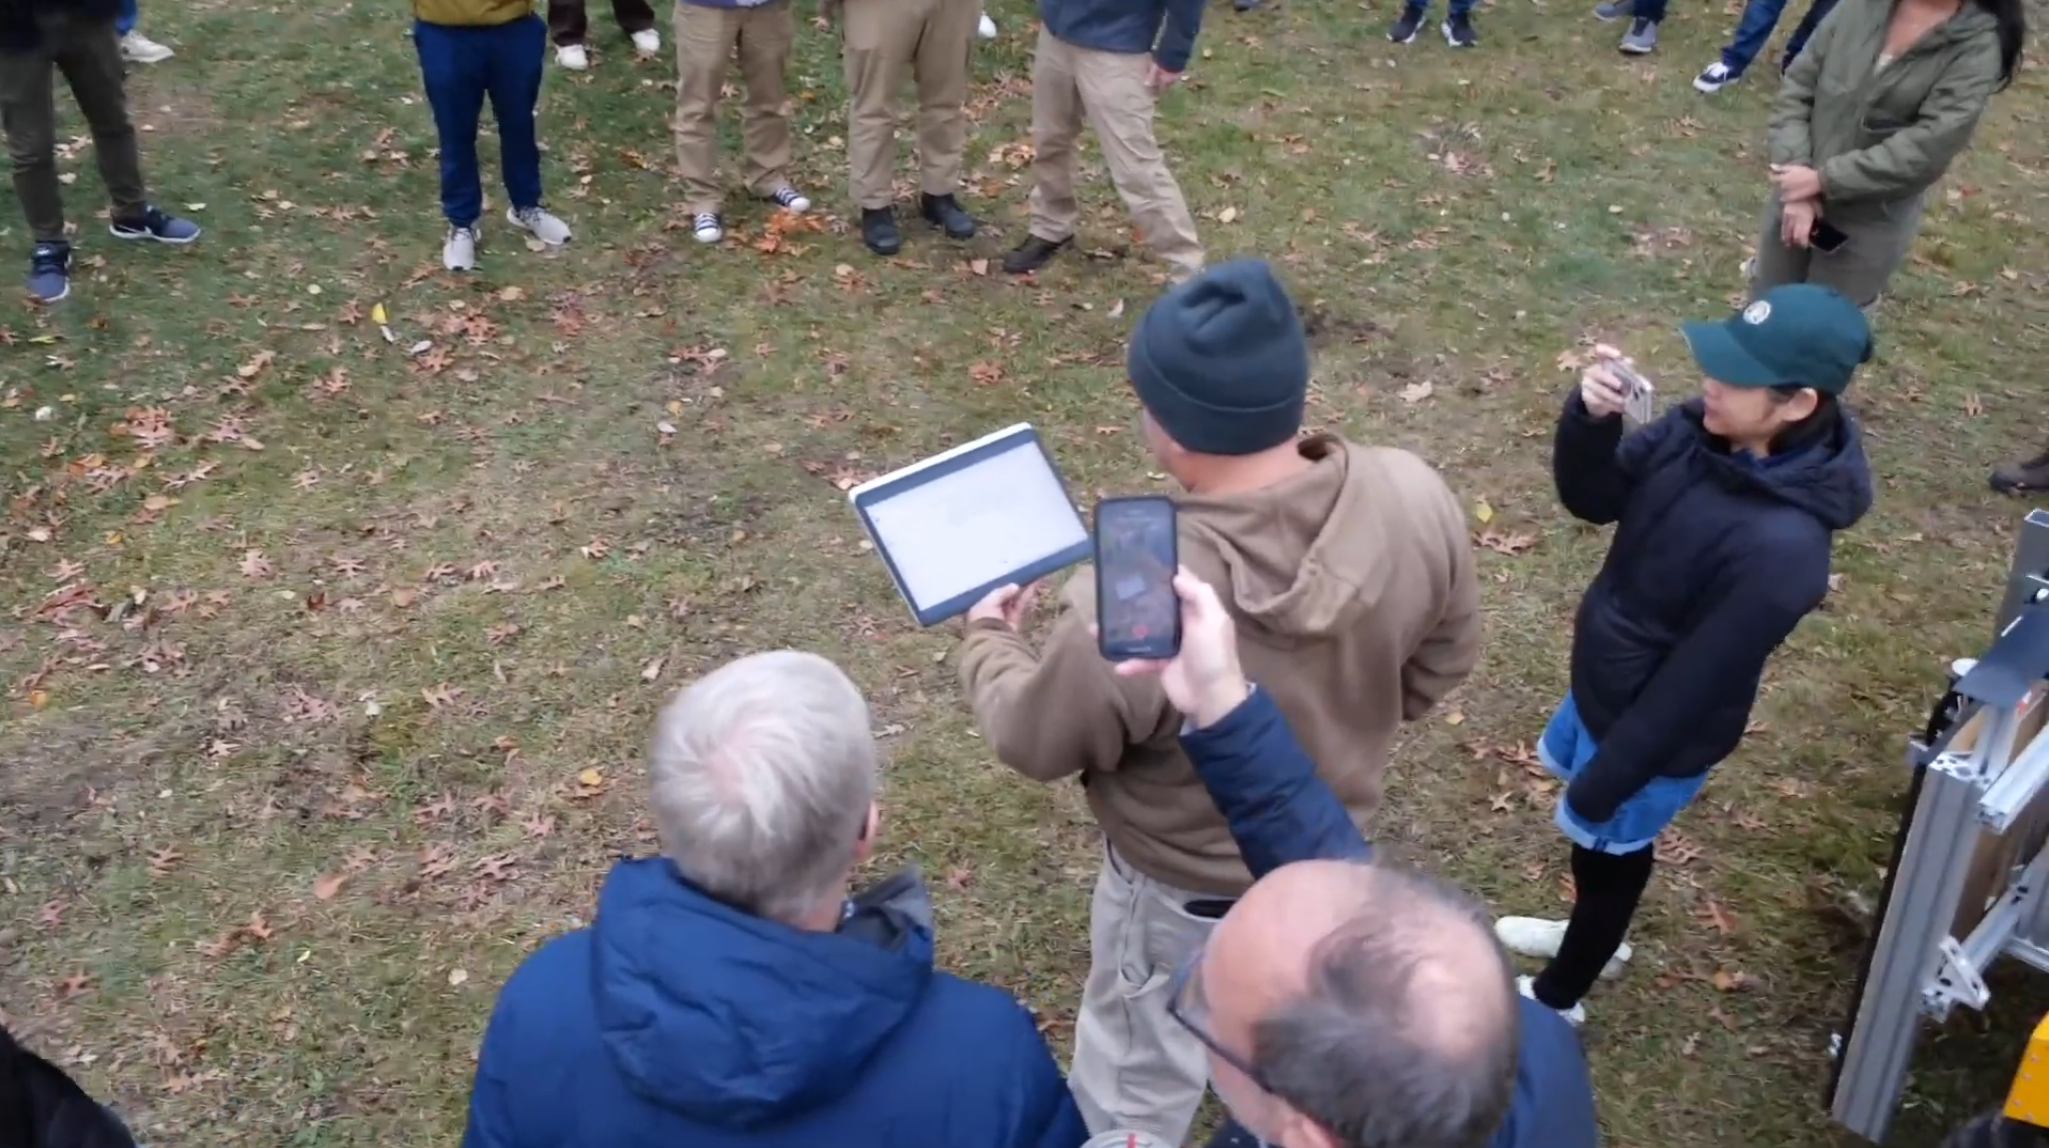
I developed a companion reforestation planning tool called Canopy and conducted thorough user studies to shape and validate the design, including a partnership with professional foresters from the Pennsylvania Bureau of Forestry. The foresters had zero prior experience with the system, yet the interface enabled them to design and execute planting plans on a tablet with no training— a direct result of iterating on UX through real stakeholder feedback.
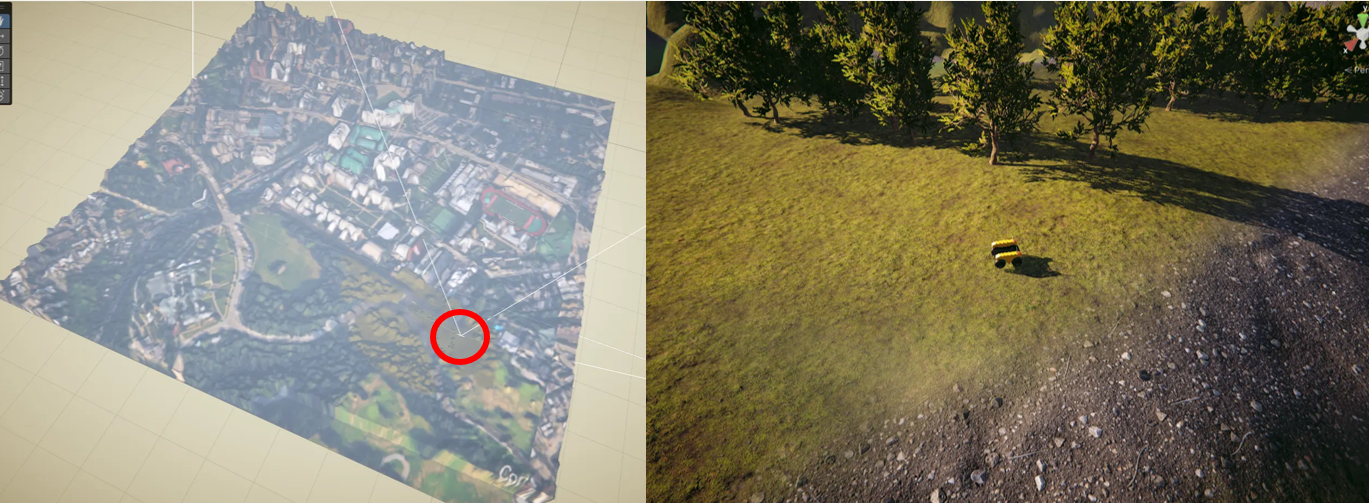
In addition to Canopy, I developed a custom agroforestry robotics simulator called Ecosim, which served as a drop-in replacement for telemetry and actuation. This proved essential for hardware-in-the-loop testing and validation, saving us time and improving safety over premature and costly field tests.
I also wrote thorough online documentation for the robot’s diagnostics and software architecture, using a Markdown-to-HTML workflow.
The robot won the Excellence in Regenerative Agriculture award in the 2025 Farm Robotics Competition, the biggest competition of its kind in the world.
🎥 Project overview video (YouTube)
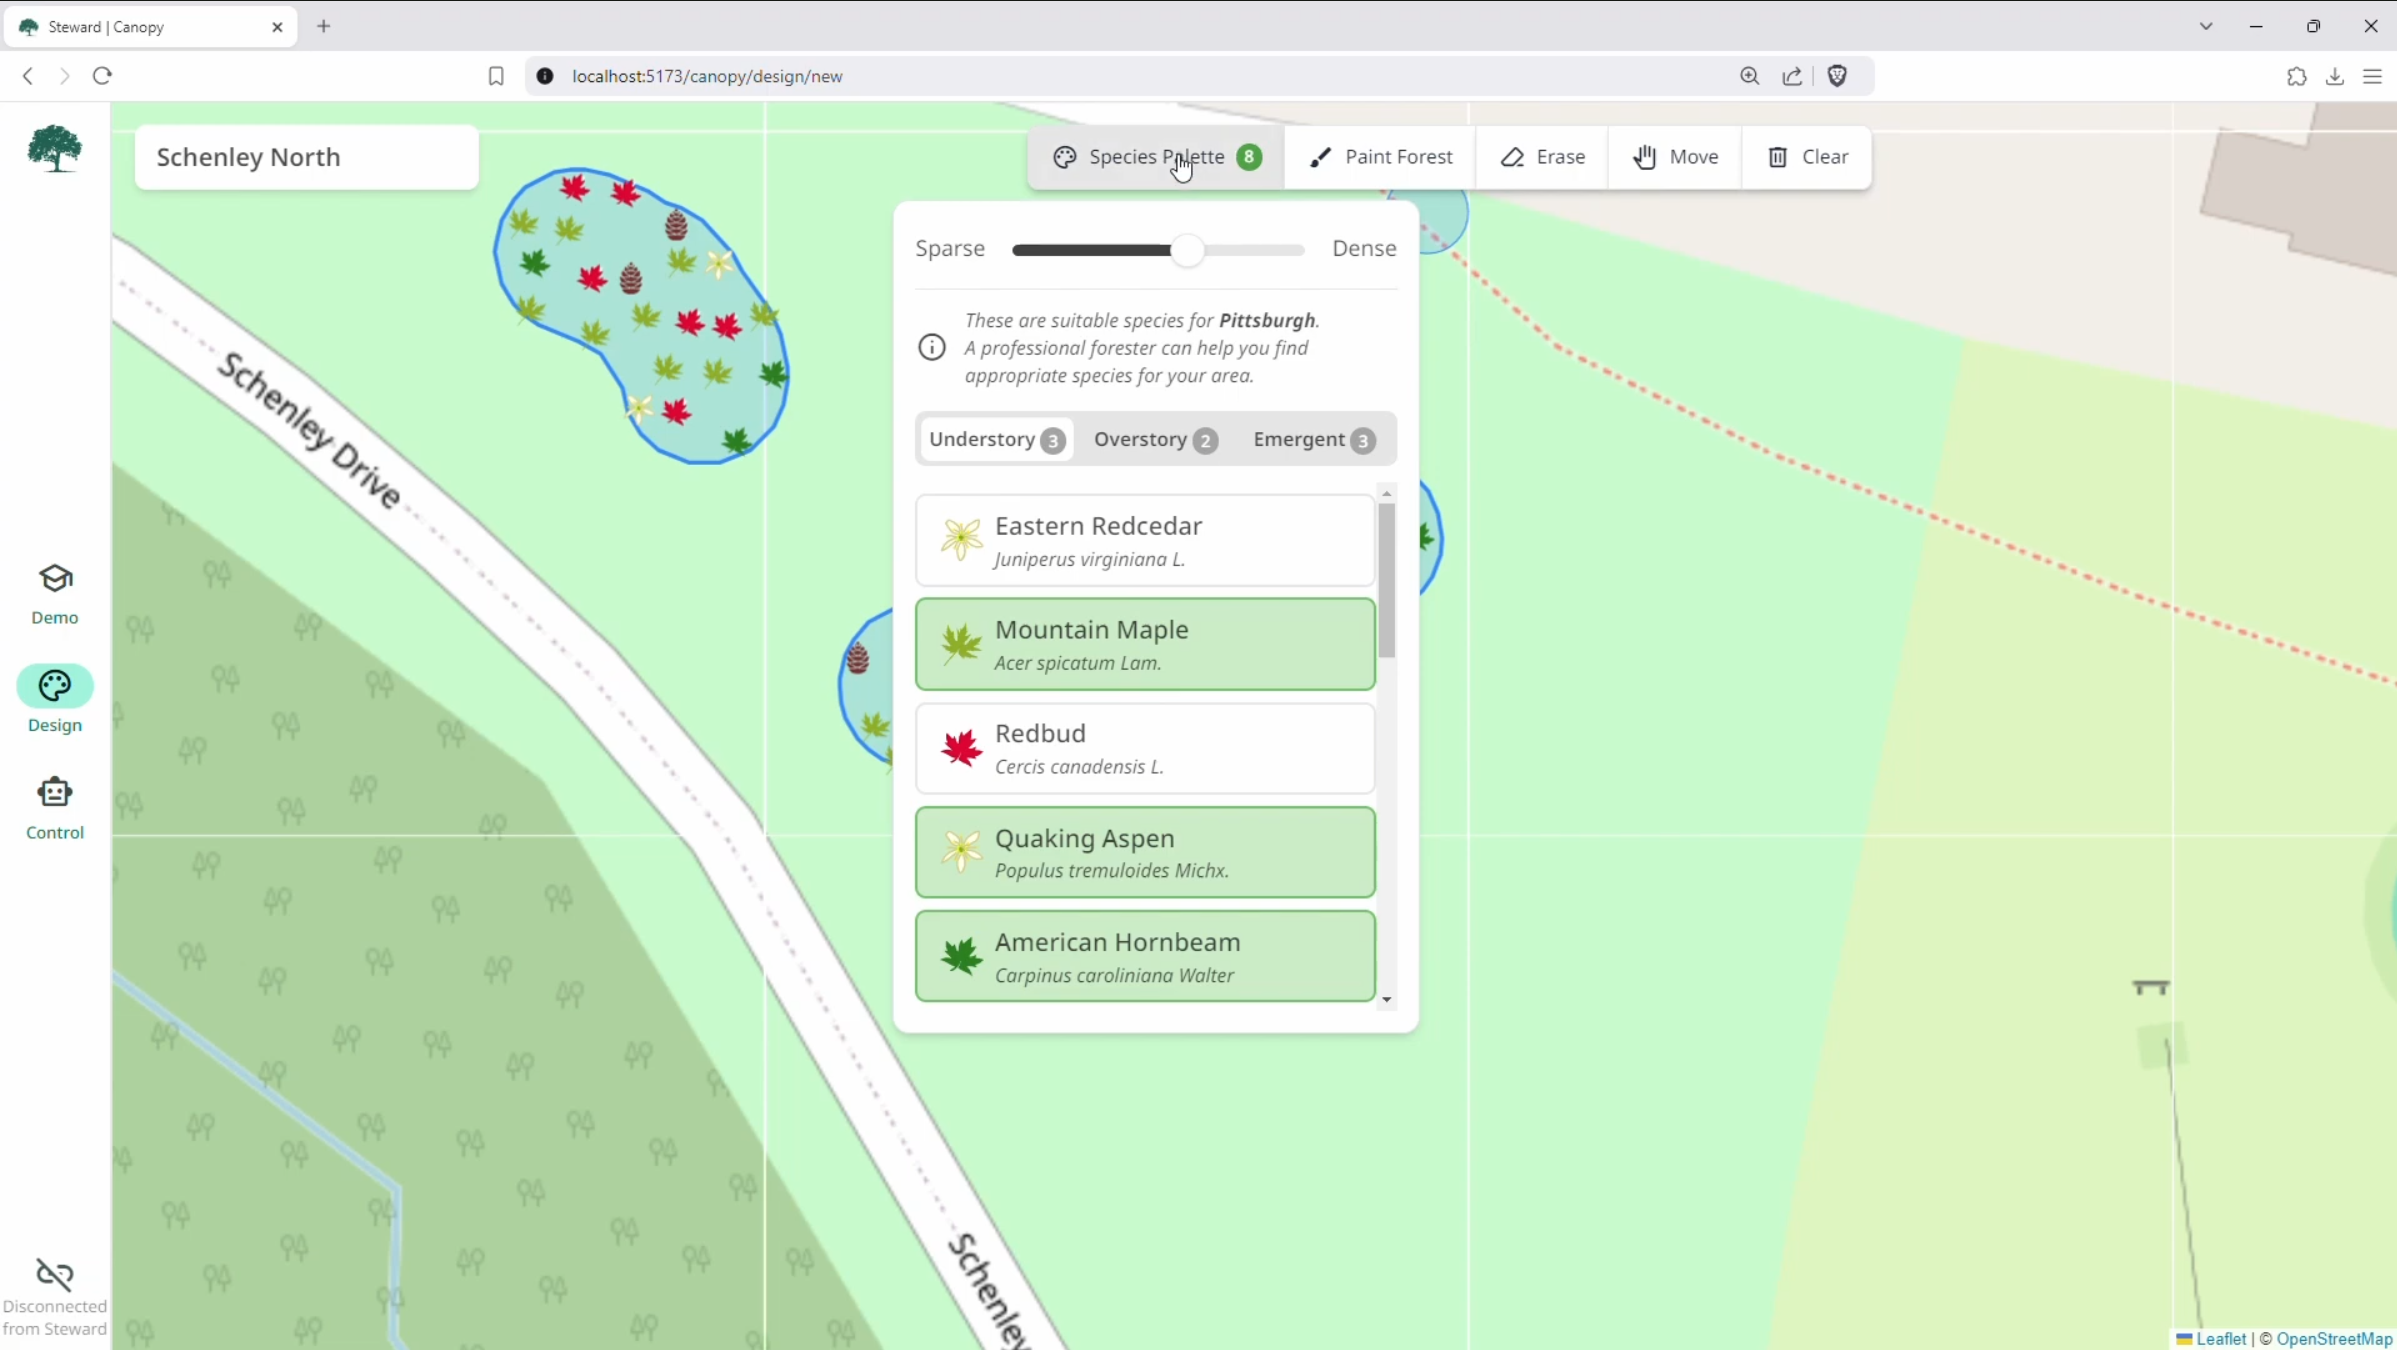
Canopy is a full-stack forest planner. Users select the trees they'd like to plant-- guided by climate-appropriate recommendations-- and simply paint them onto the map. The precise species mix and distribution is determined by an RL policy that I developed in the backend and trained on a forest growth model, with near-instant inference times. Planning a forest is as simple as finger painting.
Technologies used: Svelte, three.js, roslibjs, ROS Web Bridge, Unity, Figma.
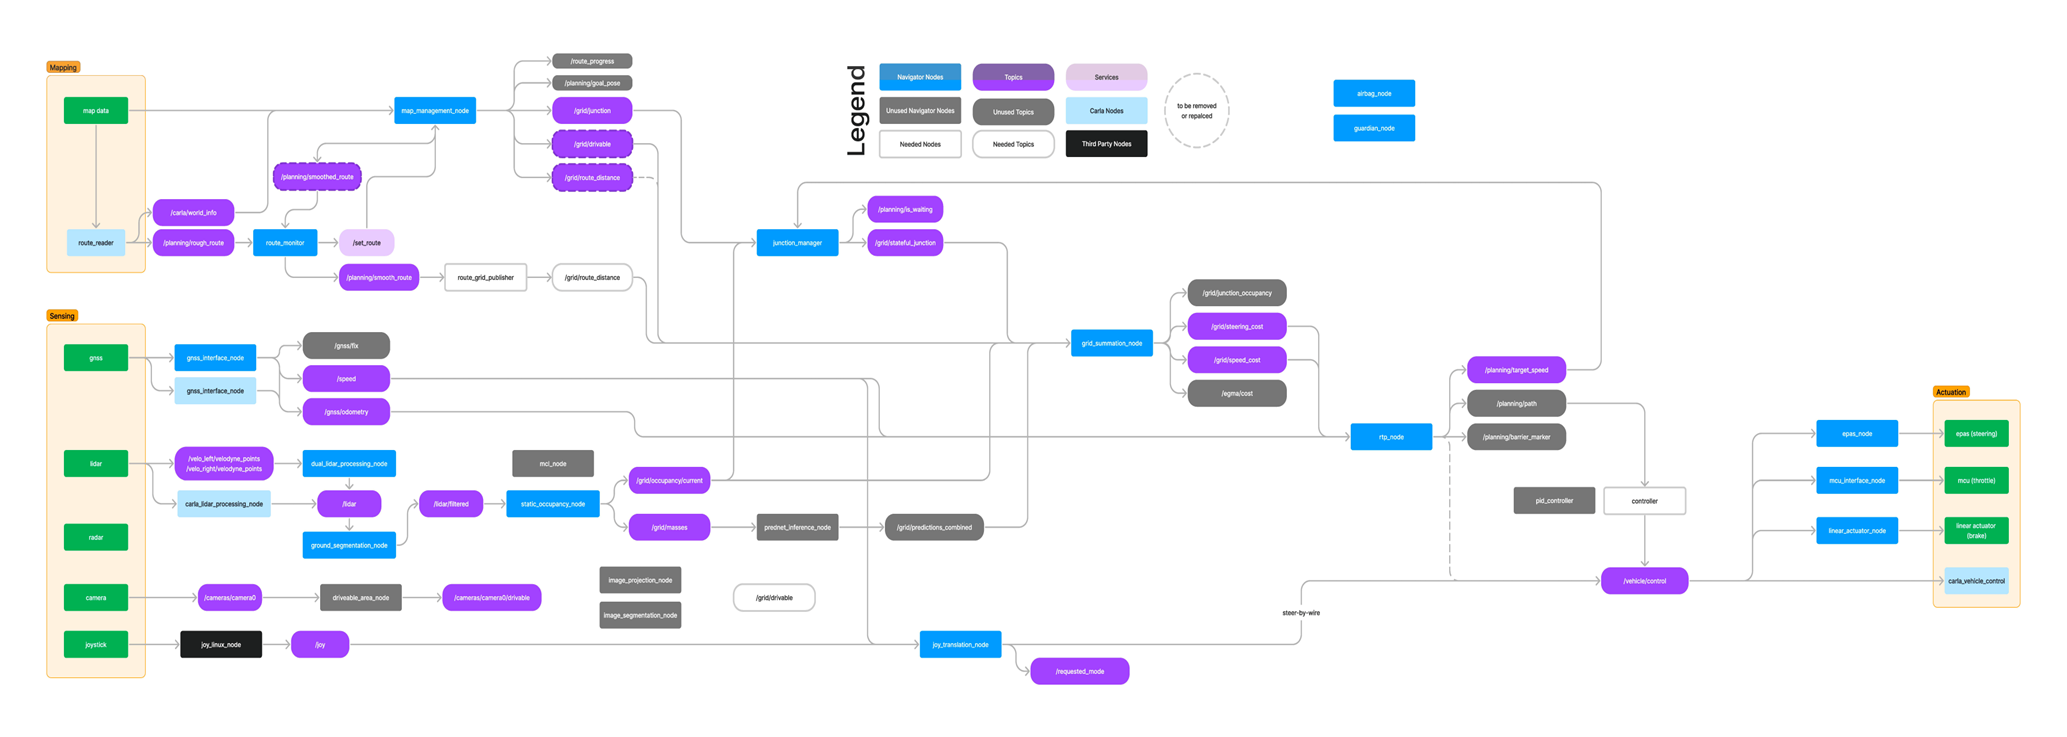
Autonomous driving platform (2019 — 2023)
From 2019-2023, I founded and led an autonomous driving research project at UT Dallas, leading to a publicly deployed self-driving car. I developed and architected the key software stack, including a web-based user interface. This web tool, which filled a touchscreen mounted to the dashboard, provided rich, real-time data on the complete AV stack, including the diagnostic system that I developed. The center of the screen showed the car in 3D (interactive, three.js) along with its environment (occupancy grids and point clouds) and decision making (route candidates and trajectories). The bottom edge showed system warnings and errors as simple icons so that drivers could read quickly and safely. Tapping an icon opened a detailed panel that listed the complete issue and potential fixes.
This is the same design pattern I’d advocate for at BD: surface the critical info at a glance, then let the user drill into details on demand.
Here’s the documentation that I created (now supplemented by other contributors) built atop— you guessed it!— a Markdown-to-HTML workflow. I also built our main team website (since updated to show new members).
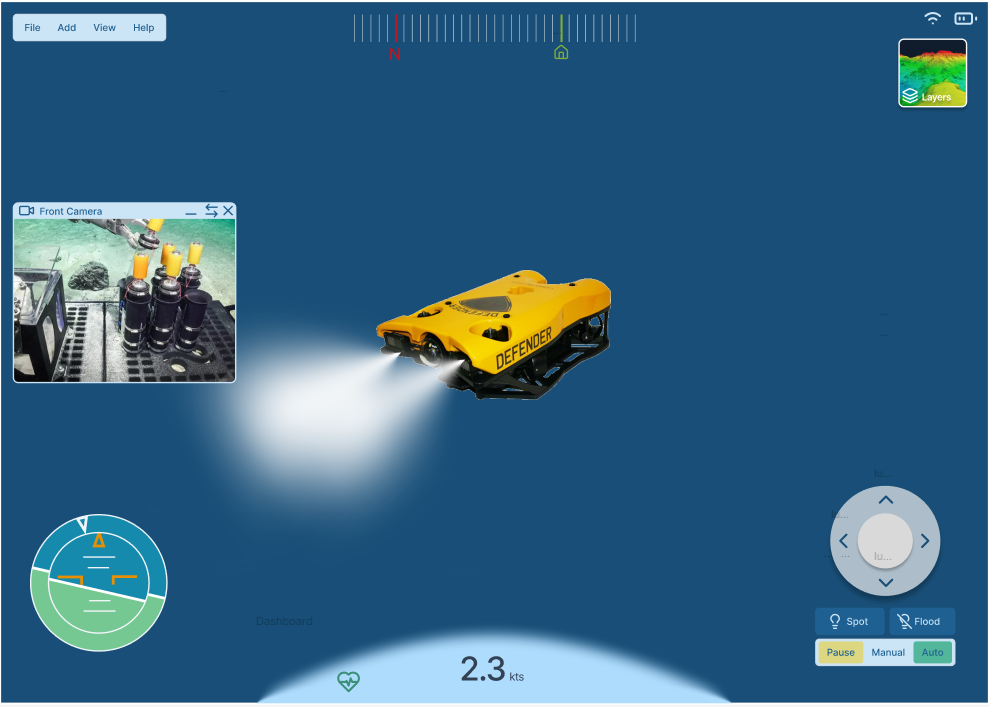
Underwater ROV control Figma mockup
As a one-day design challenge for VideoRay in 2025, I mocked up this control app in Figma. This is a direct screenshot from Figma.
Technical depth overview
Full-stack development & APIs: I’ve built performant APIs to gather and stream diagnostics asynchronously, with compressed sensor streams and downsampling. I’ve consumed APIs ranging from NASA meteorological data for crop modeling to Franka arm control interfaces. I’ve developed custom binary protocols for streaming LiDAR data over WiFi. On the frontend, I build in Svelte with an obsessive attention to design— every pixel aligned, every interaction considered.
Python & C++: I’ve used Python to build everything from web servers to SLAM algorithms to CNNs. I’ve used C++ to write safety-critical firmware for sensors and actuators, high-performance sensor filters, and behavior state machines for field robots.
Documentation & static sites: My personal website uses a Markdown-to-HTML workflow (mdsvex and remark, with math extensions) and static site generation via Svelte’s static adapter. I’ve also written chat interfaces for LLMs using marked and several sites using Jekyll and GitHub Pages.
Git & collaboration: Here’s my personal GitHub. I both contribute and review PRs professionally at RAI, and I’ve led collaborative development across multi-disciplinary teams on every project listed here.
UX design: I’ve used Figma to develop and share mockups for projects including Canopy, and I’m obsessive about UX right down to the tittles and ligatures in typefaces. Good design speaks volumes— and for field-facing tools, good design means the difference between a quick fix and a frustrated technician or customer.
Systems engineering: I take satisfaction out of optimizing the separations of concerns and interfaces between components in cyberphysical systems. Backed by hard-earned lessons in the field and bolstered by systems engineering courses at CMU, I’ve learned to design— and document— reliable systems built to last and to scale.
Here are examples of some open-source systems that I’ve architected.
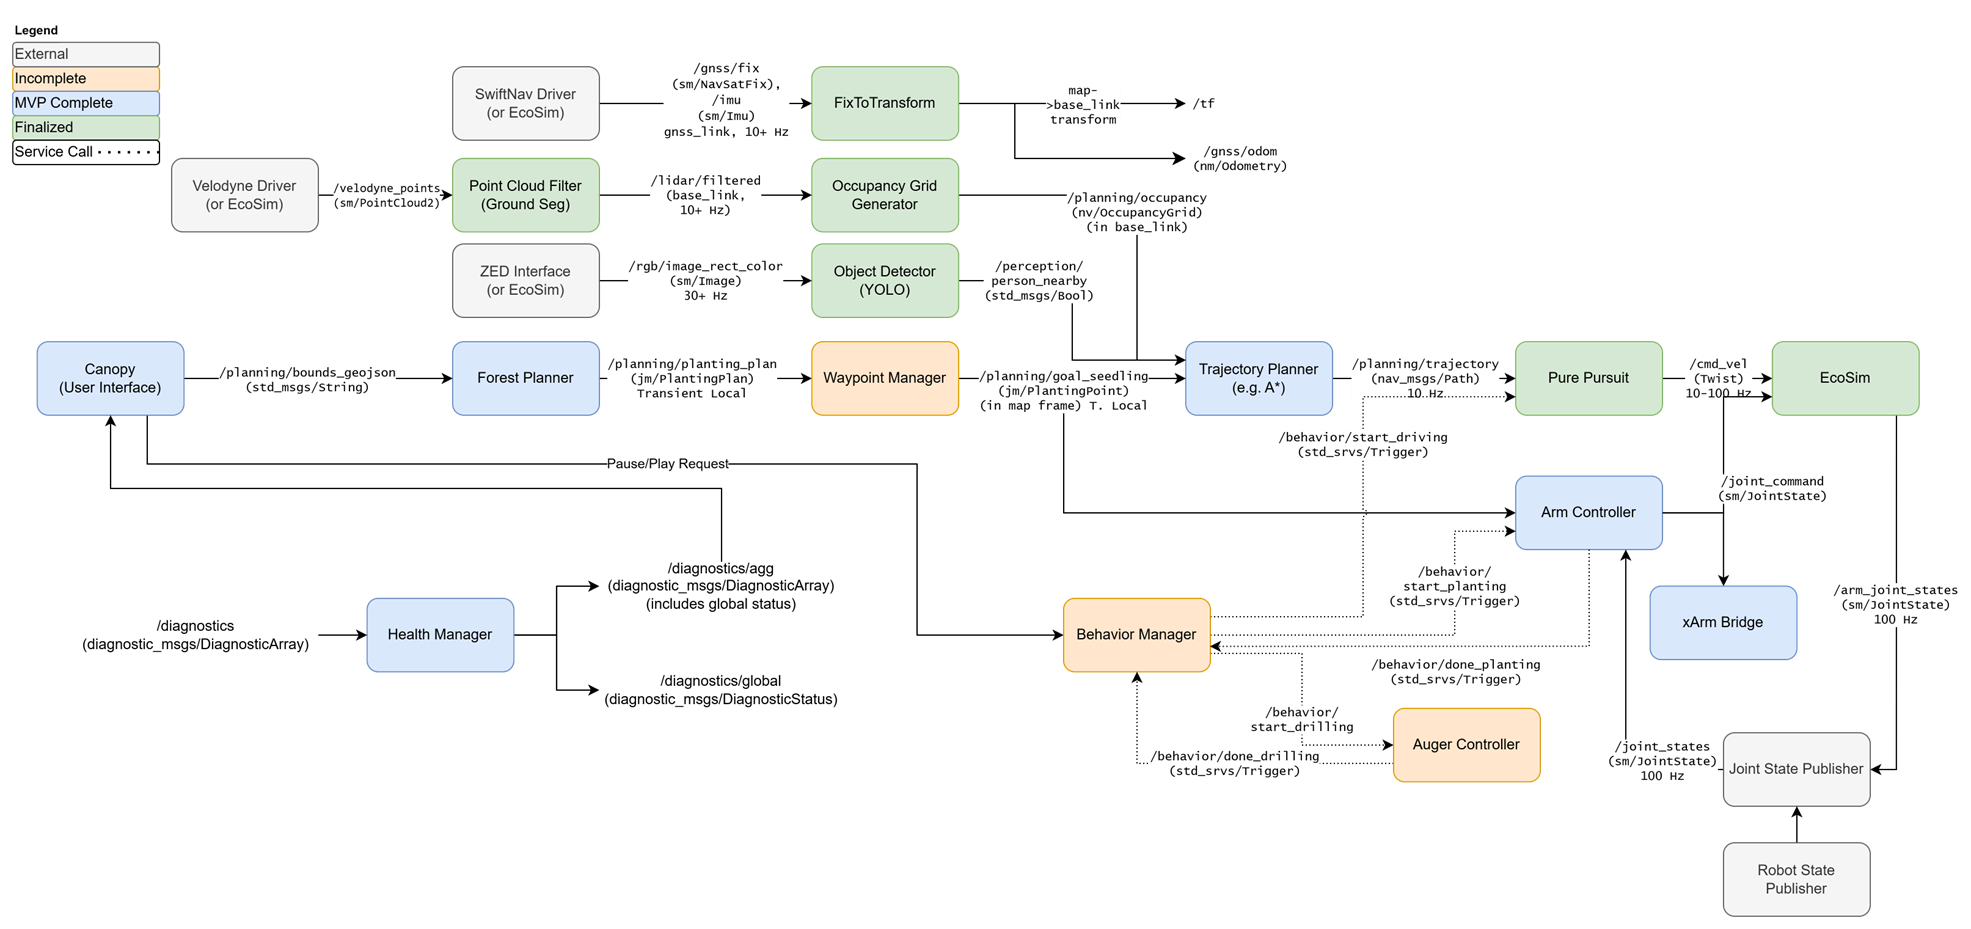
The software diagram for Jonny, the second reforestation robot that I helped build at CMU.